Coefficient of Determination
When looking at relationships through a correlation or regression analysis, we often use the coefficient of determination as a measure of effect size. This is also referred to as R-squared. In a multiple linear regression analysis, we typically use the adjusted R-squared value.
Computing R-Squared
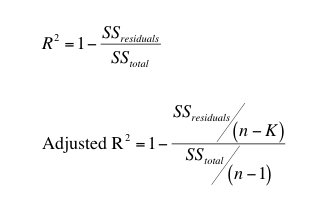
As with Cohen's d, we can compute the R-squared value using a formula. There are several different formulas that can be used. Here is just one example:

where:
In order to complete this computation, you must also know how to compute each sum of squares (deviations from the mean), which can be a time-consuming process, especially with larger data sets. Thankfully, like with Cohen's d, we can also use technology to compute the R-Squared.
R-Squared using SPSS
1) Correlations
Computing R-Squared when conducting a correlation analysis is pretty simple. When you run a correlation analysis, you are computing "r", the correlation coefficient. In order to obtain R-Squared, we simply square the correlation value, that is we multiply the correlation coefficient by itself. See the correlation guide for help with running a correlation analysis.
2) Regression
Each time you conduct a regression analysis in SPSS, a table will automatically be included that contains the R-Square and Adjusted R-Square values, as shown below:

When reporting the results for our analysis, we would include that the R2 = .305. This means that approximately 30.5% of the variability in the outcome variable is explained by the regression model.
Interpreting the Coefficient of Determination
The coefficient of determination tells us how much variability in the outcome/dependent variable is explained by the relationship between the variables. In a correlation, that relationship is only between the two variables. In a regression analysis, it's referring to the regression model as a whole.
You'll notice that when conducting a simple linear regression, with only 1 predictor and 1 outcome variable, the R-square value is the same as what you would get if you run a simple correlation analysis between those two variables. This is because the model is based on the relationship between only those two variables.
**For additional assistance with computing and interpreting the effect size for your analysis, attend the SPSS: Correlation/Linear Regression group session**
© Copyright 2025 National University. All Rights Reserved.