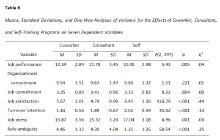
This sample table displays the results of multiple analyses of variance (ANOVAs). When there is only one analysis to report, no table is required. The means, standard deviations, and ANOVA results are presented in the text rather than in a table. The results of a single ANOVA may be presented in tabular form in theses and reports, but this would have to be verified by the writer. In addition, one-way ANOVA results often are presented in tables for theses and for journals if there are several independent ANOVAs to be reported; however, some disciplines prefer not to present ANOVA results in tables but rather to present relevant means in tables or in figures.
Adapted from Presenting Your Findings: A Practical Guide for Creating Tables, Sixth Edition (pp. 51, 57), by A. M. Nicol and P. M. Pexman, 2010, American Psychological Association (https://www.apa.org/pubs/books/4316117). Copyright 2010 by the American Psychological Association.
Academic Writer
© 2024 American Psychological Association.
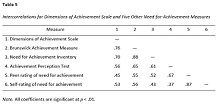
This sample table displays correlations. When reporting the results of correlational analyses, a table usually is necessary only if there are more than two variables. In that case, the relevant tables are a table of means and standard deviations (or standard errors) and a table of intercorrelations among all variables included in the analysis or a table of correlations between two sets of variables. The table of means and standard deviations and the table of intercorrelations can be combined into one table. The table format used depends on the nature of the study.
Adapted from Presenting Your Findings: A Practical Guide for Creating Tables, Sixth Edition (pp. 41, 43), by A. M. Nicol and P. M. Pexman, 2010, American Psychological Association (https://www.apa.org/pubs/books/4316117). Copyright 2010 by the American Psychological Association.
Academic Writer
© 2024 American Psychological Association.
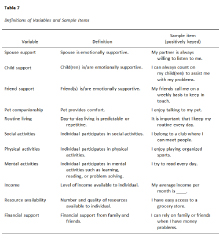
This sample table displays text, that is, descriptive or qualitative information. The types of information included in text tables include definitions of variables, descriptions of referenced studies, and order of presentation of training phases. Usually, one table is used for each type of descriptive information presented. Text tables are used sparingly; a text table should be included only if a thorough description is required and if a description in the text would be too confusing or too cumbersome.
Adapted from Presenting Your Findings: A Practical Guide for Creating Tables, Sixth Edition (pp. 157, 159), by A. M. Nicol and P. M. Pexman, 2010, American Psychological Association (https://www.apa.org/pubs/books/4316117). Copyright 2010 by the American Psychological Association.
Academic Writer
© 2024 American Psychological Association.
![]()